Data limits
Next steps
Control access to Infrastructure Explorer by reviewing the required Permissions.
Related resources
Last updated on
Control access to Infrastructure Explorer by reviewing the required Permissions.
Coralogix is introducing fair usage limits for Infrastructure Monitoring to ensure platform stability, predictable performance, and fair access for all customers. These limits apply specifically to Infrastructure Explorer and the data you send to it.
View your infrastructure data usage in the Data Usage screen under Settings, then Data Usage. While infrastructure data is currently metered at 0 units, it still follows fair usage limits. Learn more about Data Usage
The following table summarizes the main fair usage limits:
| Limit name | Applies to | Fair usage limit | Description |
|---|---|---|---|
infra_monitoring_events_processed | Event ingestion | 1 million/hour | Number of infrastructure events allowed per hour. |
infra_monitoring_event_payload | Attribute size | Max 256 characters/value | Attribute value length in infrastructure monitoring events. |
infra_explorer_active_items | Infrastructure Explorer | 100,000 active items | Maximum items shown in Infra Explorer (nodes, pods, volumes, etc.) |
infra_explorer_retention_period | Infrastructure Explorer | 7 days | How long historical data is retained. |
Each limit is designed to prevent:
They define what is considered fair and reliable use of the system at your current plan level.
Each limit is enforced differently:
| When limit is exceeded | System behavior |
|---|---|
infra_monitoring_events_processed | A circuit breaker is triggered. All incoming events are blocked until the next hour. |
infra_explorer_active_items | New items over the limit are blocked from appearing in Infrastructure Explorer. This can cause data discrepancies between different Infrastructure Explorer views, such as Pods showing different counts than Workloads/Deployments. |
infra_monitoring_event_payload | Attribute values longer than 256 characters are truncated or dropped. |
infra_explorer_retention_period | Older data is automatically deleted after 7 days. |
If you see inconsistent counts between views or expected data in Infrastructure Explorer, check whether you have exceeded your account's fair usage limits.
Symptoms of hitting the limit:
How to verify:
labs.limitViolations dataset for detailed diagnostic logs for limit violations.To capture detailed diagnostic logs for limit violations, enable the labs.limitViolations system dataset:
labs.limitViolations for write access.By default, system datasets are disabled to prevent unnecessary quota usage. Enabling the dataset ensures that diagnostic violation logs are stored and available for querying.
Disable diagnostic logs once you have completed your investigation to avoid unnecessary log volume.
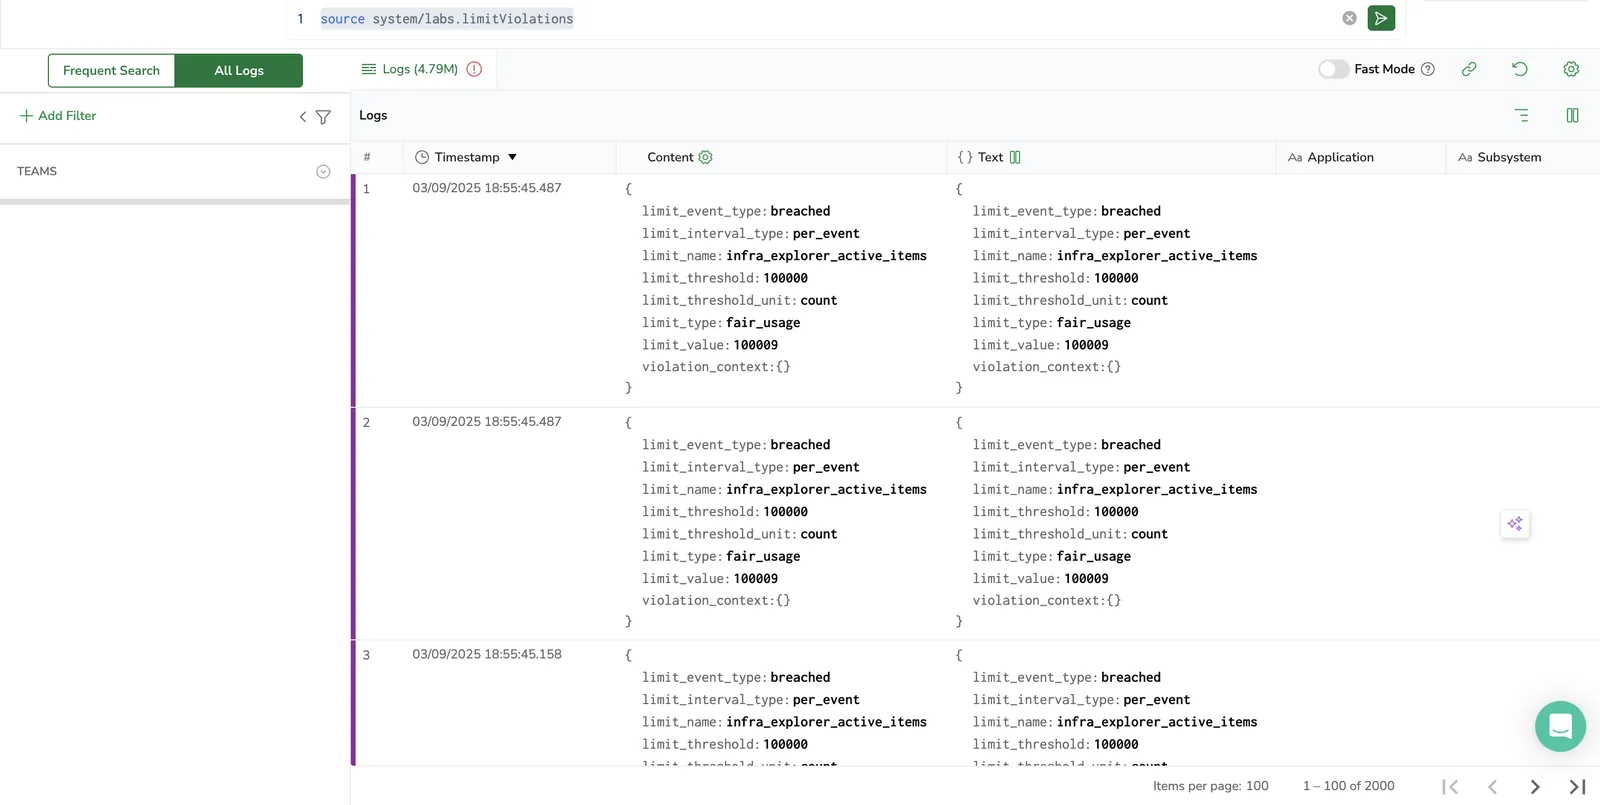
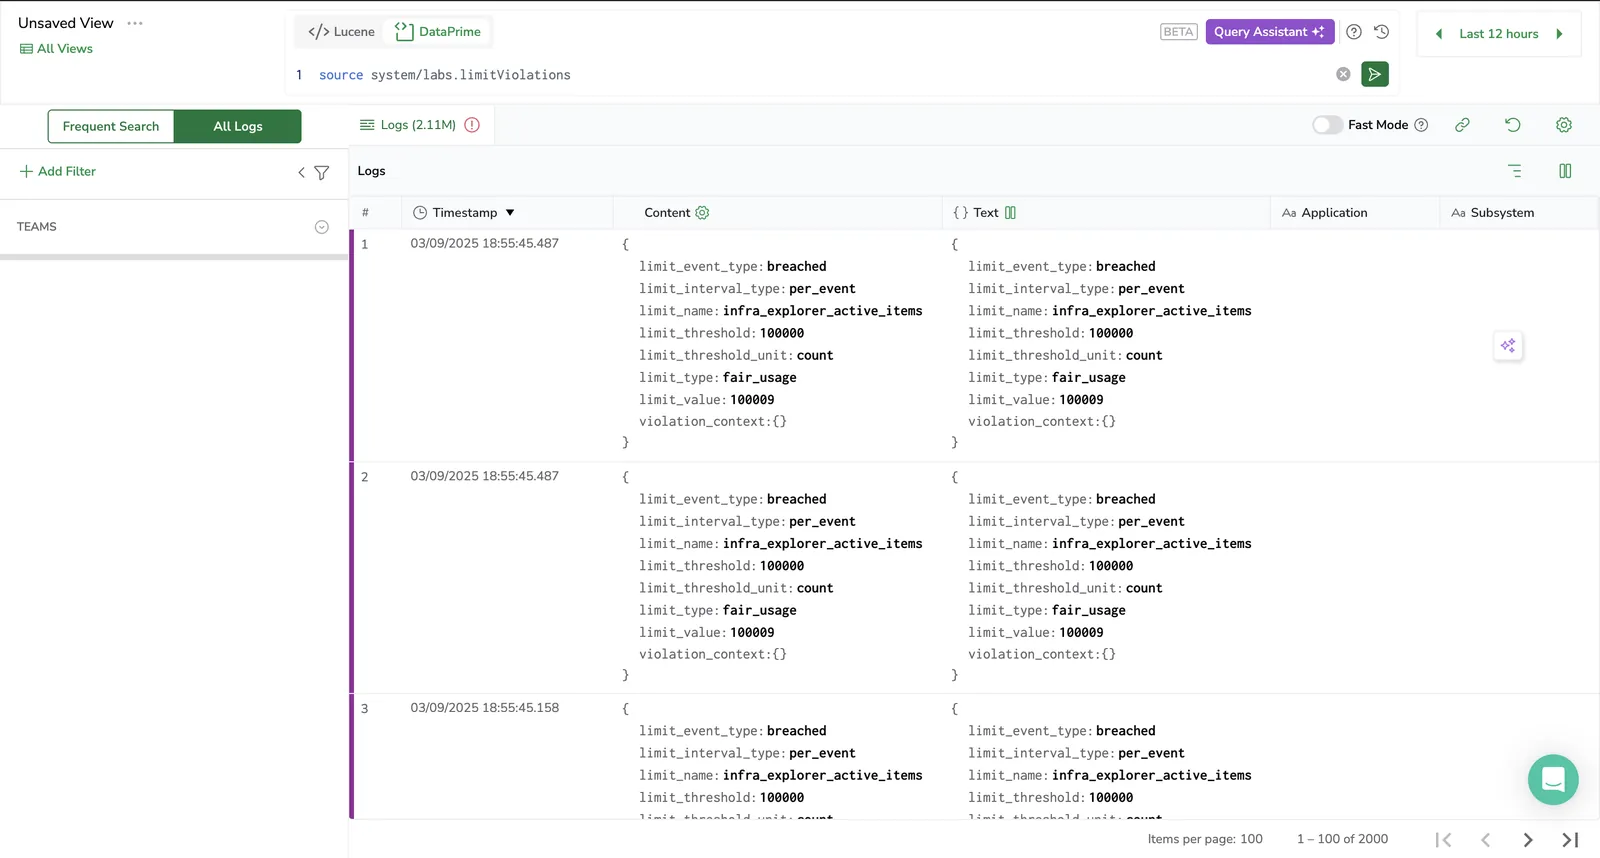
Diagnostic logs from labs.limitViolations appear only when you filter Logs Explorer to All Logs. The Frequent Search filter hides dataset-backed logs. Datasets cannot be queried with Lucene—you must use DataPrime.
Diagnostic logs are ingested into the labs.limitViolations system dataset. Standard log ingestion and retention charges apply based on your account plan. The volume depends on how frequently limits are breached—typically low for well-configured environments. To control cost, enable diagnostic logs only during active investigation.
When a limit is crossed, Coralogix also emits a diagnostic log that includes:
{
  "limit_name": "<name of the limit>",
  "environment": "<env>",
  "fair_usage_threshold": "<value defined>",
  "current_value": "<current_value_that_breached>",
  "timestamp": "<RFC 3339>",
  "labels": <additional_key_values_for_any_sub_division>
}
Example:
{
"limit_name": "infra_monitoring_events_processed",
"environment": "eu-west-1",
"fair_usage_limit": "5000000",
"current_value": "5000001",
"timestamp": "2025-07-22T14:30:00Z",
"dimensions": {}
}
These logs appear in your log ingestion pipeline so you can track violations and remediate proactively.
Run this to see all categories of violation logs
query:
source system/labs.limitViolations
event: infra_monitoring_events_processed
query:
source system/labs.limitViolations | filter $d.limit_name ~ 'infra_monitoring_events_processed'
event: infra_explorer_active_items
query:
source system/labs.limitViolations | filter $d.limit_name ~ 'infra_explorer_active_items'

event: infra_monitoring_event_payload
query:
source system/labs.limitViolations | filter $d.limit_name ~ 'infra_monitoring_event_payload'
event: infra_explorer_retention_period
query:
source system/labs.limitViolations | filter $d.limit_name ~ 'infra_explorer_retention_period'
Your current Infrastructure Monitoring usage is visible in the Usage tab of the Coralogix app. Select Settings, then Data Usage, then Infrastructure data
| Section | Description |
|---|---|
| Total Events | Cumulative number of infrastructure events sent in the selected time window. |
| Daily Max | The peak number of events on a single day during the selected period. |
| Stacked | Daily breakdown of:• Infrastructure events (light orange)• Blocked infrastructure events (dark orange)• Quota line for reference |
| Breakdown Table | Shows daily usage broken down by:• Infrastructure events: All ingested events• Blocked infrastructure events: Dropped or rejected eventsEach day shows the event count and unit usage |
Yes. Configure the OpenTelemetry Collector to filter or drop unnecessary infrastructure events before they reach Coralogix. For more information, see Advanced Configurations.
For example:
filterStatements:
  - 'body["metadata"]["namespace"] != "kube-system"'
  - 'body["kind"] != "Event"'
This reduces usage and ensures only important data appears in your infrastructure dashboard.