Getting started with Kubernetes monitoring
Getting started
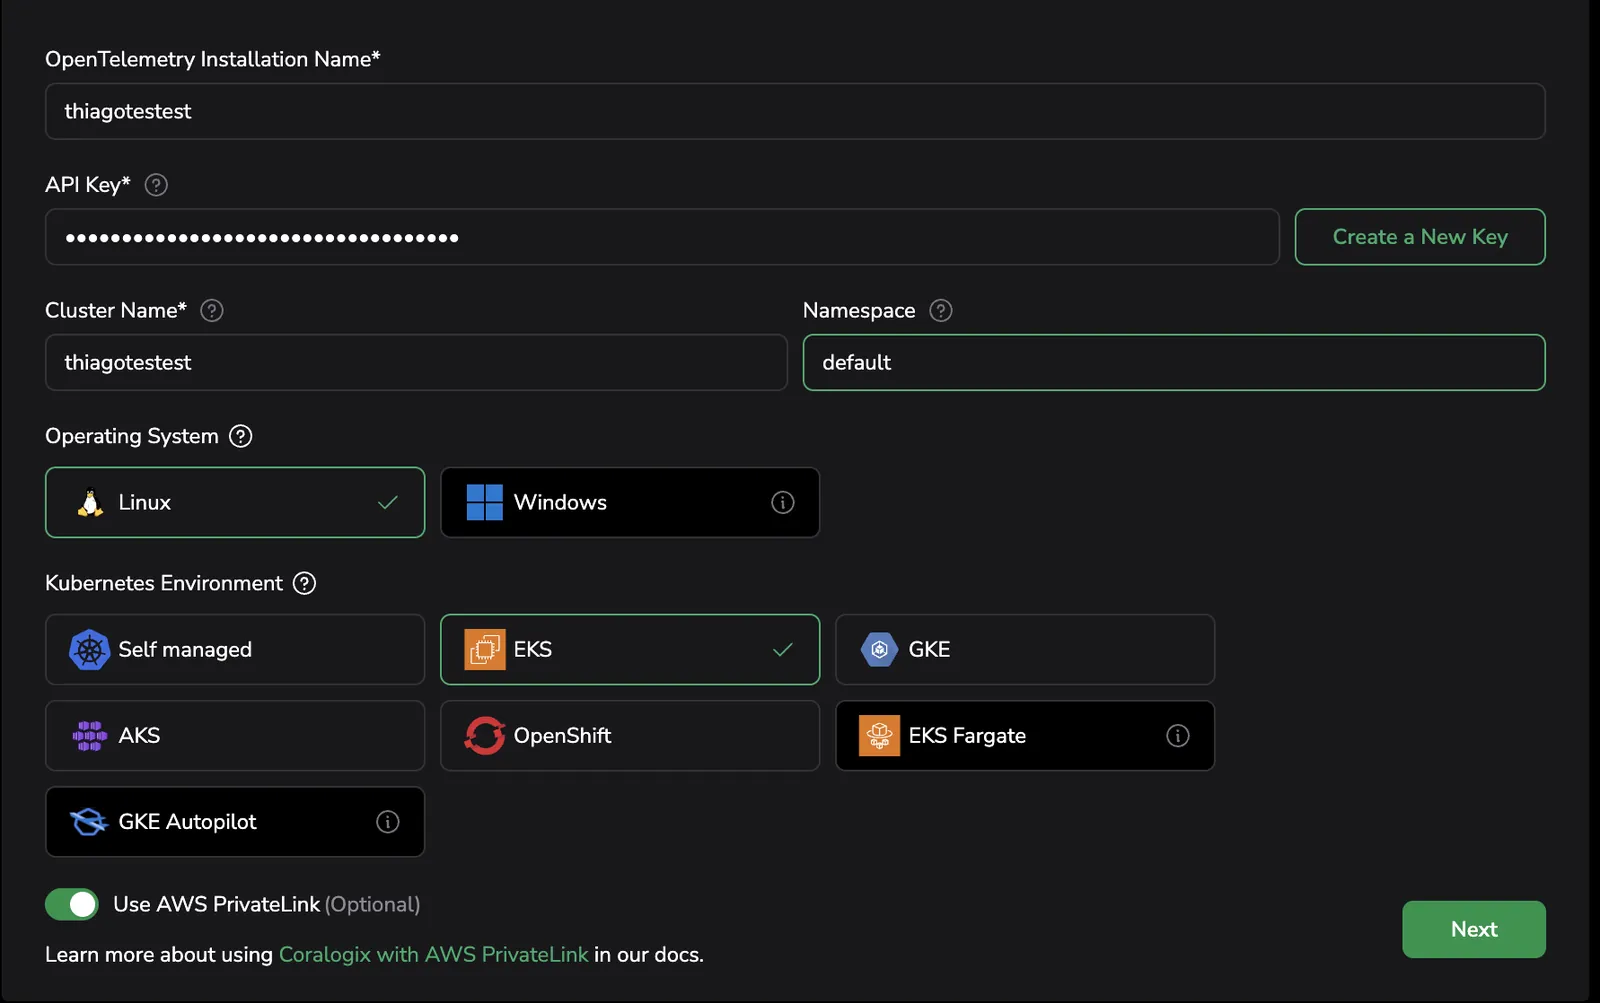
To use Infrastructure Explorer, begin by setting up the Kubernetes Complete Observability Integration. This integration collects logs, metrics, metadata, and traces across your Kubernetes environment.
To get started:
For a full walkthrough, see the Kubernetes Complete Observability configuration guide.
Enable observability features
Once you're under the Observability Features section of the setup wizard, enable the following toggles to activate the necessary features for Infrastructure Explorer:
- Host metrics: Collects host-level CPU, memory, disk, and network usage
- Process Metrics: Enables host process collection using the
processpreset
- Process Metrics: Enables host process collection using the
- Kubelet metrics: Collects node, pod, container, and volume metrics via the
kubeletstatsreceiver - Cluster metrics: Pulls cluster-wide metrics from the Kubernetes API server
- Kubernetes extra metrics: Captures additional Kubernetes component metrics
- Scrape all: Enables extended metric coverage
- Collector metrics: Monitors internal performance metrics from the OpenTelemetry Collector
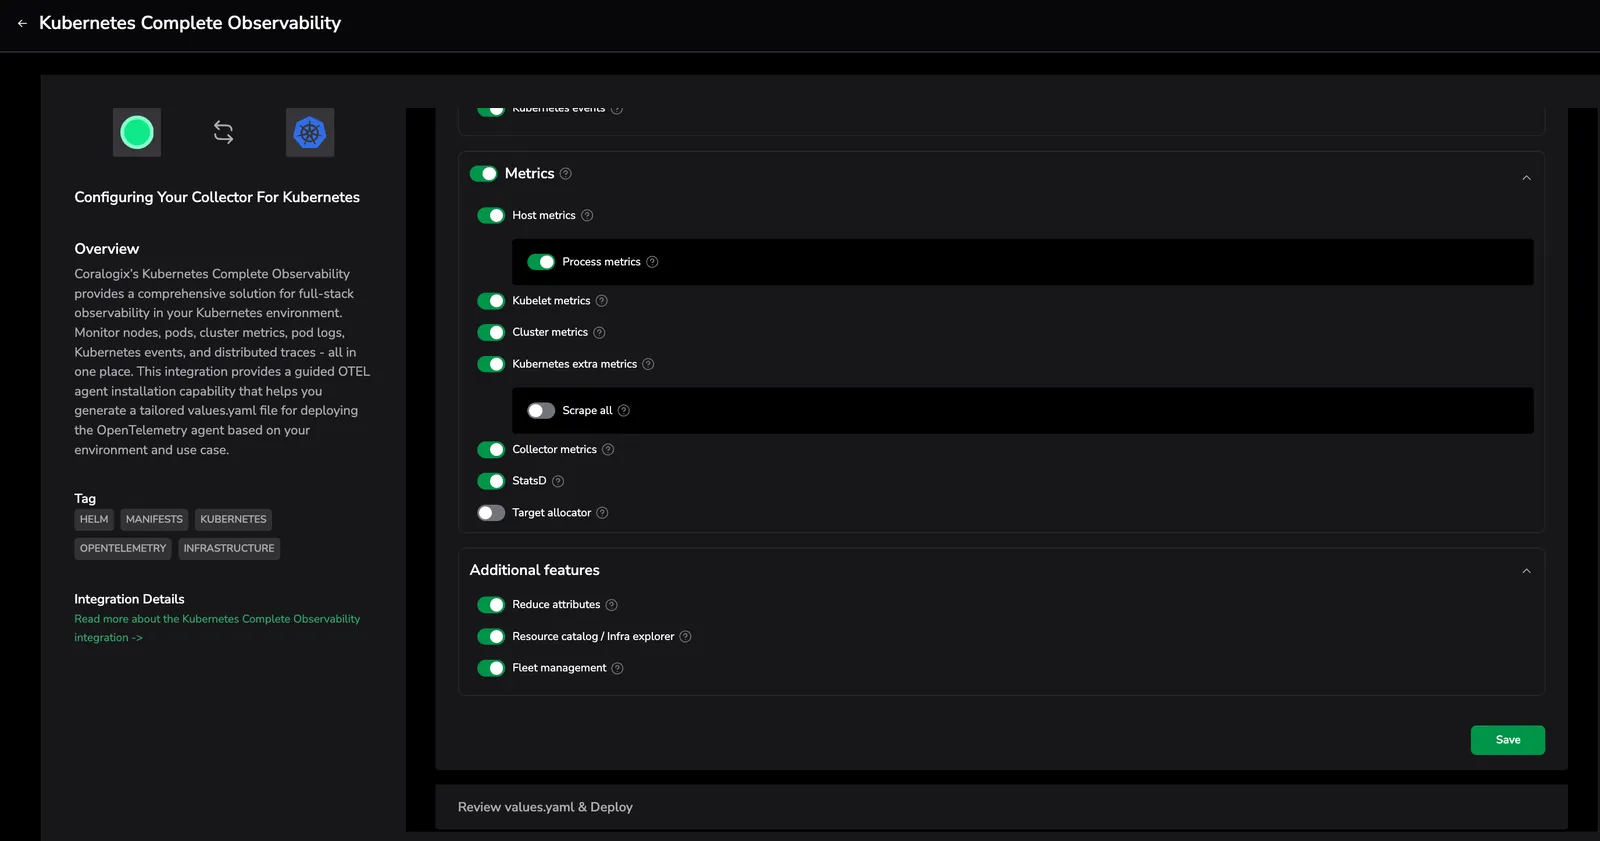
Key toggle: Resource Catalog / Infra Explorer
Under Additional Features, enable this toggle to activate Infrastructure Explorer's core functionality, including:
- Live infrastructure metadata
- Resource relationships (e.g., pod-to-node)
- Ownership and tag-based filtering
- Searchable inventory of Kubernetes and cloud entities
Once enabled, navigate to Infrastructure, then Infrastructure Explorer in Coralogix to begin using it.
For full installation and Helm deployment steps, refer to the Kubernetes Complete Observability.
For advanced enrichment and filtering options, see Kubernetes Enrichment Options.
Next steps
Enrich host metadata and send application telemetry to the Coralogix agent by configuring Kubernetes enrichment options.