Set up Continuous Profiling
This guide provides step-by-step instructions for setting up Continuous Profiling (CP). Coralogix Continuous Profiling captures low-overhead CPU profiles (via eBPF) and memory profiles (via the Java SDK), helping you identify performance bottlenecks directly within the Coralogix platform.
You can install Continuous Profiling in three ways:
- Using the Coralogix CP agent together with the Coralogix collector on Kubernetes (Helm-based installation)
- Using the Coralogix onboarding UI via Kubernetes Complete Observability (UI installation)
- Using the AWS ECS-EC2 OpenTelemetry integration (CloudFormation-based installation)
For memory profiling on Java services, see Monitor memory consumption — memory profiling uses the Coralogix Continuous Profiler SDK and Async Profiler instead of the eBPF agent described on this page.
Kubernetes prerequisites
- Ensure that kubectl is installed.
- Confirm environment requirements:
-
Kubernetes v1.24+
-
Helm v3.9+
To verify your Helm version, run the following:
helm version
-
Install with CP agent and Coralogix collector (Helm)
This installation path provides full control over deployment and configuration using Helm. The Coralogix collector, which includes the OpenTelemetry (OTel) collector, serves as the central component for receiving and forwarding telemetry data-including profiling, traces, and metrics-into the Coralogix platform. By deploying the CP agent alongside the collector, you enable comprehensive observability across your Kubernetes workloads.
If you have the Coralogix collector already installed, you can skip steps 1 and 2.
-
Add the Coralogix Helm chart repository and update your local Helm repo cache by running:
helm repo add coralogix https://cgx.jfrog.io/artifactory/coralogix-charts-virtualhelm repo update -
Create the required secret. Ensure a Kubernetes secret named
coralogix-keysexists and includes your Coralogix Private API Key. If it doesn't, use the command below to create it:kubectl create secret generic coralogix-keys --from-literal=PRIVATE_KEY="<Your Coralogix Private API Key>" -
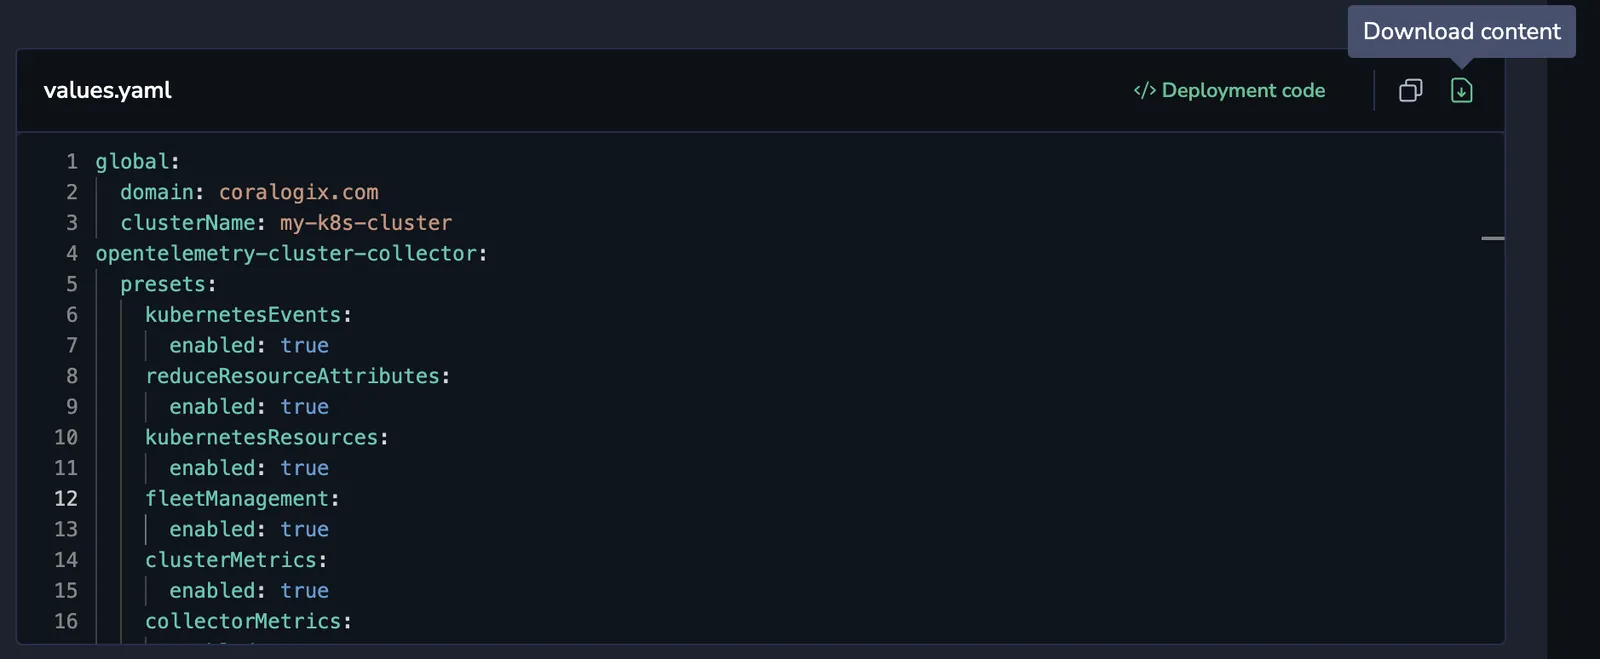
Add the following to your
values.yamlfile:opentelemetry-ebpf-profiler:enabled: truepresets:resourceDetection:enabled: falseebpfProfiler:enabled: trueotlpExporter:enabled: trueendpoint: ${env:K8S_NODE_IP}:4317pipelines: ["profiles"]tls:insecure: trueopentelemetry-agent:enabled: trueThe eBPF profiler exports profiles to the node-local
opentelemetry-agent, which enriches them with Kubernetes metadata and forwards them to Coralogix. The agent'sprofilesCollectionpreset is enabled by default, so no extra agent configuration is required for the basic install. -
Deploy Continuous Profiling by running the following. Replace
<cluster name>and<Your Coralogix Region Domain>with the appropriate values:helm upgrade --install otel-coralogix-integration coralogix/otel-integration \--version=0.0.305 \--render-subchart-notes \--set global.domain="<Your Coralogix domain>" \--set global.clusterName="<cluster name>" \-f values.yamlNoteBy default, the Coralogix Continuous Profiling agent collects profiling data from all services across your Kubernetes cluster.
To limit data collection to specific nodes—for instance, to avoid monitoring system-critical or infrastructure-dedicated nodes—you can configure node affinity, anti-affinity, and tolerations.
These Kubernetes features allow fine-grained control over pod scheduling, enabling you to tailor where the profiling agent is deployed based on node characteristics and cluster topology.
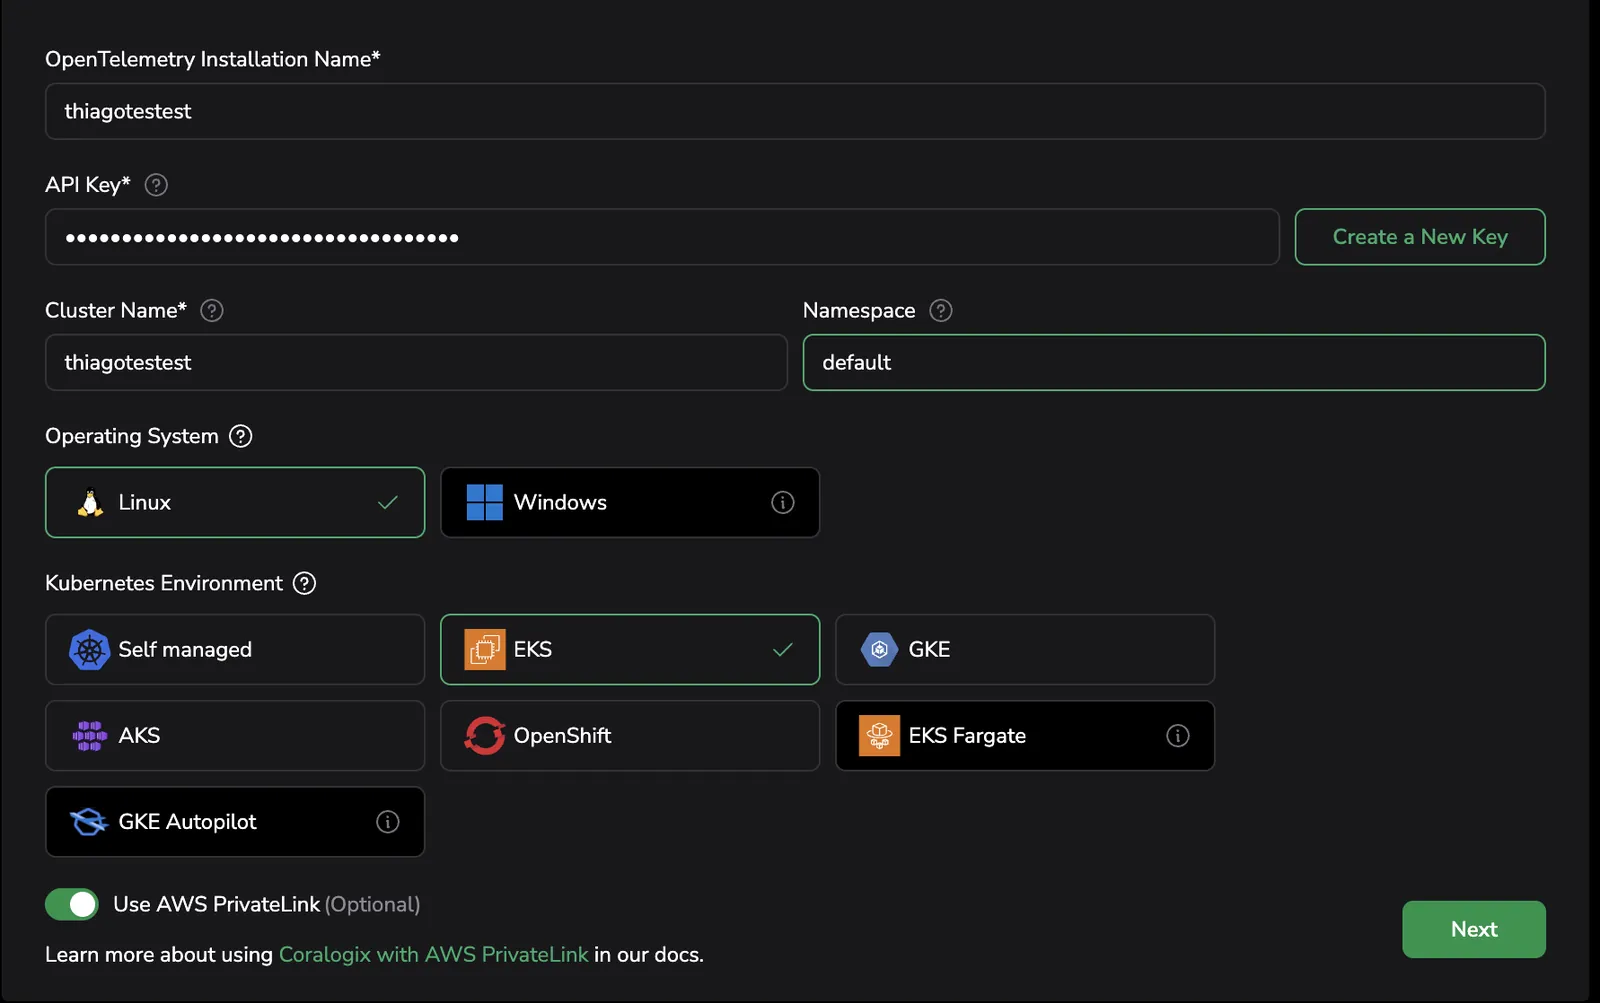
Install with Kubernetes Complete Observability (UI)
Coralogix provides a UI-based onboarding flow for Kubernetes complete observability. This method simplifies setup by guiding you through the installation process.
This integration is designed and tested for clean installs. Applying it to existing deployments may require additional checks and adjustments.
If you’ve already installed the integration using the default values.yaml, be aware that upgrading may overwrite existing configurations, and behavior in your environment is unpredictable. We strongly recommend testing updates in a staging environment first to verify compatibility, stability, and ensure you can take full advantage of new features and best practices.
Enable profiling
-
Navigate to Observability features, then to APM & Tracing (default: on).
-
Toggle Profiling on (default: off) and configure Samples per second (default: 20) to control how often data is sampled. See the image below.
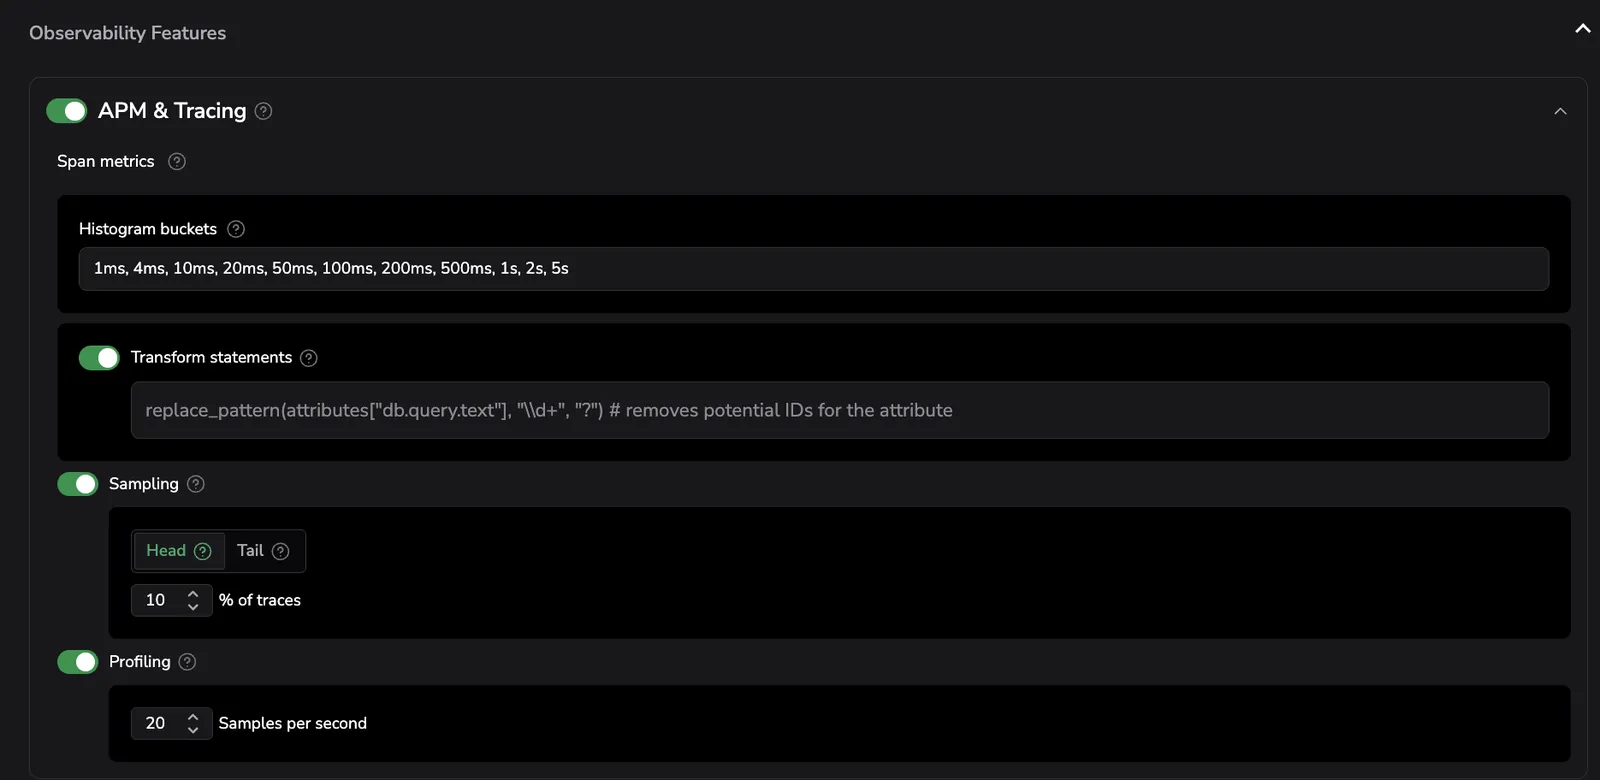
-
Select Save.
How service name is determined on Kubernetes
On Kubernetes, Continuous Profiling automatically determines the service.name attribute for your profiled services based on the OpenTelemetry Semantic Conventions for Kubernetes. The service name is resolved using the following priority order:
- Pod annotation:
resource.opentelemetry.io/service.name - Well-known Kubernetes labels (in order):
app.kubernetes.io/instanceapp.kubernetes.io/name
- Kubernetes resource hierarchy (from owner to pod):
k8s.deployment.namek8s.replicaset.namek8s.statefulset.namek8s.daemonset.namek8s.cronjob.namek8s.job.name
- Fallback:
k8s.pod.nameork8s.container.name
Custom service name detection
You can override the default service name detection by specifying custom Kubernetes labels or annotations to use for service name resolution. Add the following to your values.yaml file:
opentelemetry-agent:
  enabled: true
  presets:
    profilesCollection:
      enabled: true
      serviceLabels:
        - tag_name: "k8s.labels.my-custom-service-label"
          key: "my-custom-service-label"
          from: "pod"
        - tag_name: "k8s.labels.app.kubernetes.io/name"
          key: "app.kubernetes.io/name"
          from: "pod"
      serviceAnnotations:
        - tag_name: "k8s.annotations.my-custom-service-annotation"
          key: "my-custom-service-annotation"
          from: "pod"
        - tag_name: "k8s.annotations.resource.opentelemetry.io/service.name"
          key: "resource.opentelemetry.io/service.name"
          from: "pod"

opentelemetry-ebpf-profiler:
  enabled: true
  presets:
    resourceDetection:
      enabled: false
    ebpfProfiler:
      enabled: true
    otlpExporter:
      enabled: true
      endpoint: ${env:K8S_NODE_IP}:4317
      pipelines: ["profiles"]
      tls:
        insecure: true
| Configuration | Description |
|---|---|
serviceLabels | List of Kubernetes pod labels to use for resolving the service name. Labels are evaluated in order; the first matching label with a value is used. |
serviceAnnotations | List of Kubernetes pod annotations to use for resolving the service name. Annotations are evaluated in order; the first matching annotation with a value is used. |
When both serviceLabels and serviceAnnotations are configured, annotations take precedence over labels.
AWS ECS-EC2 prerequisites
- An ECS cluster using the EC2 launch type. Fargate is not supported, because the eBPF profiling agent requires direct access to host kernel interfaces that Fargate tasks cannot expose.
- CloudFormation as your deployment method. Profiling is not available in the Terraform deployment path.
- An S3 bucket where you can upload the generated profiling configuration file.
- The AWS ECS-EC2 integration version 0.7.0 or later. Earlier versions do not include the profiling option.
Install on AWS ECS-EC2 with CloudFormation
Profiling is enabled as part of the standard AWS ECS-EC2 OpenTelemetry onboarding flow. When you turn it on, the generated CloudFormation template provisions a dedicated profiling collector service that runs alongside the existing OTel collector and reads kernel data through eBPF.
For the broader AWS ECS-EC2 integration guide, see AWS ECS-EC2 OpenTelemetry integration. The following steps cover only the profiling-specific configuration.
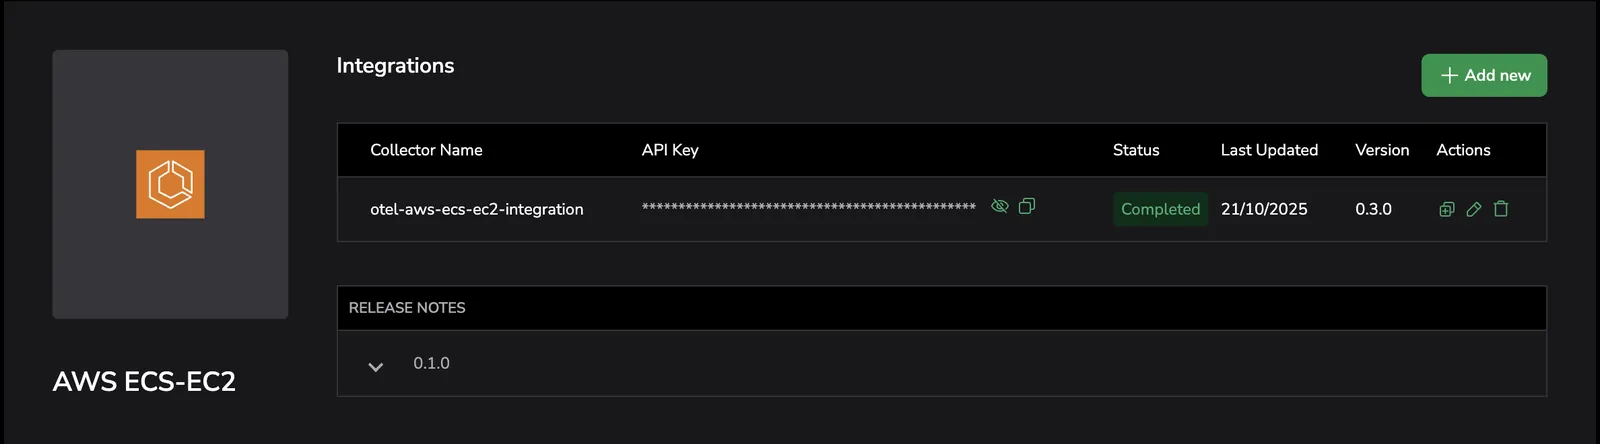
1. Start the ECS-EC2 integration
-
In Coralogix, go to Integrations.
-
Select AWS ECS-EC2.
-
Select + Add New to start a new integration, or select the upgrade arrow on an existing integration to move it to a version that supports profiling.
-
Provide a name, Send-Your-Data API key, cluster name, AWS region, and operating system.
-
In Deployment Method, keep CloudFormation selected, then select Next.
2. Enable profiling
-
Navigate to Observability features, then to APM & Tracing (default: on).
-
Toggle Profiling on (default: off).
-
Set Samples per second to control how often profiling data is sampled. The default is
20.
-
Select Next.
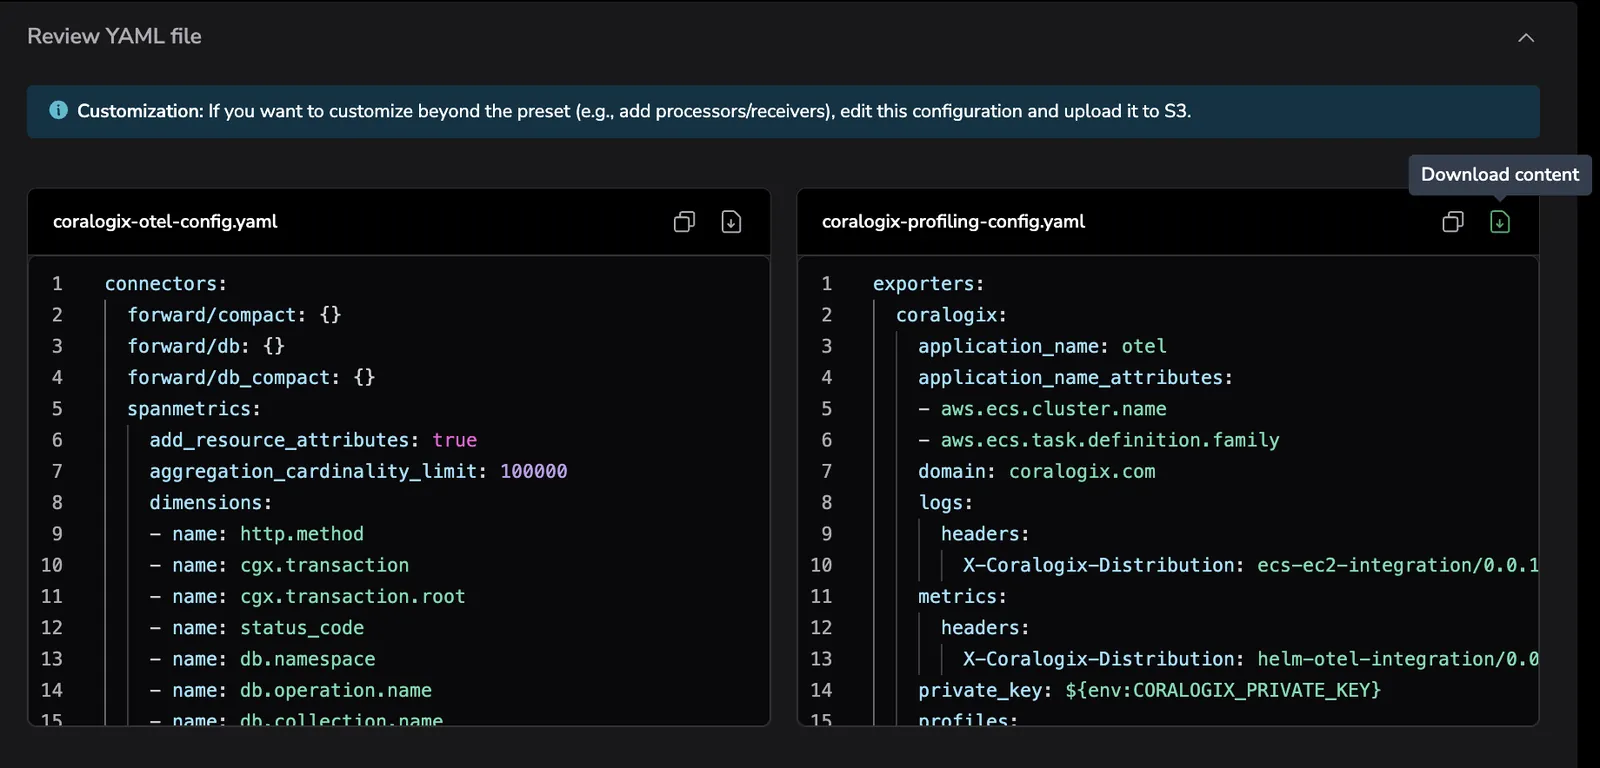
When profiling is enabled, the integration generates an additional configuration file, coralogix-profiling-config.yaml, alongside the standard coralogix-otel-config.yaml.
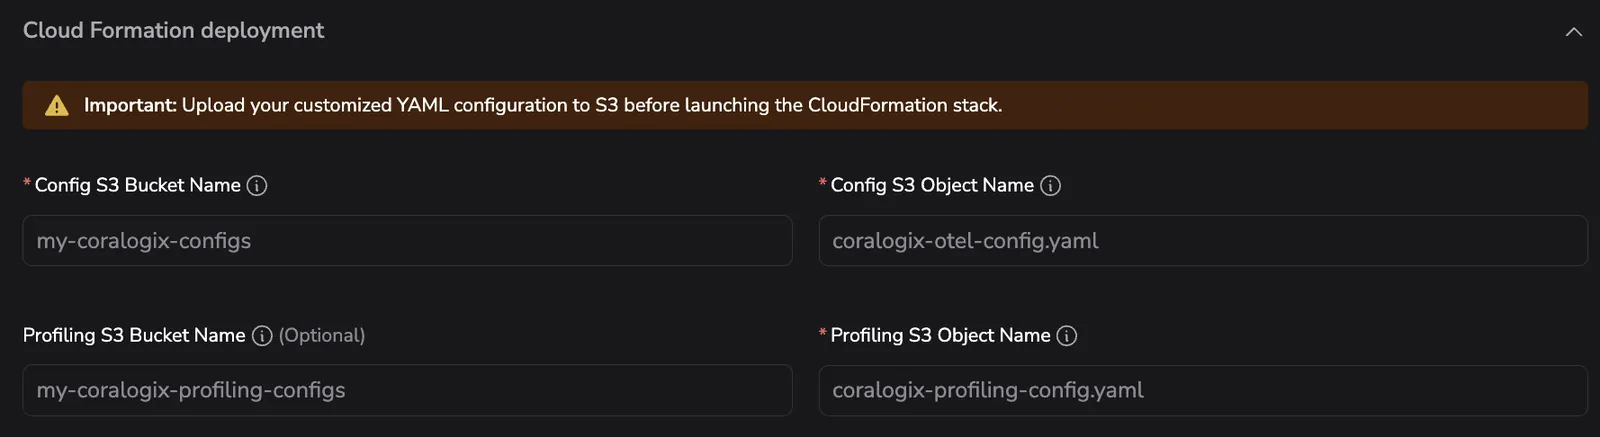
3. Provide profiling deployment parameters
In the review and deployment steps, supply the following profiling-specific parameters:
| Parameter | Description |
|---|---|
| Profiling S3 Bucket Name | The S3 bucket where you will upload coralogix-profiling-config.yaml. |
| Profiling S3 Object Name | The S3 object key (file path) for the profiling configuration file. Defaults to profiling-config.yaml. |
| Profiling Memory (MiB) | The amount of memory allocated to the profiling task. Defaults to 512. |
Upload coralogix-profiling-config.yaml to the S3 bucket using the same name you supplied for Profiling S3 Object Name.
4. Deploy the CloudFormation stack
Follow the in-app deployment instructions to create or update the CloudFormation stack. The template provisions a separate ECS service for the profiling collector that:
- Runs alongside the existing OTel collector on each EC2 container instance.
- Mounts
/sys/kernel/tracingand/sys/kernel/debugfrom the host so the eBPF profiling agent can read kernel data. - Reads its configuration from the S3 object you specified.
After the stack reaches CREATE_COMPLETE (or UPDATE_COMPLETE), select Complete setup in the Coralogix UI.
5. Verify the installation
- In Coralogix, go to APM, then Service Catalog.
- Open the Profiles tab.
- Confirm that the services running on your ECS cluster appear with profiling data.
Next steps
Learn how to view and explore profiled services in the Profiles catalog.