Explores from a Case
A Case is the starting point for investigation, not the end of it. From any Case, you can pivot directly into the relevant Explorer or Catalog with the time range and entity context already applied, so you do not have to rebuild the query manually.
The destination depends on which signal you are following.
- Logs
- Traces
- APM
When the Case is backed by log data (either a log alert, or a metric or trace alert with related log activity), the Triage tab surfaces sample logs from the Case time range. Select Explore logs to open the Logs Explorer scoped to the same time range and the Case's entity labels. Use this when the sample logs hint at a pattern you want to query against the full dataset.
For trace-based alerts and for Cases with related span activity, the Triage tab shows a sample of relevant spans. Select Explore traces to open the Spans Explorer scoped to the Case time range and entity labels. Use this when you need full span context (service dependencies, latency distribution, or error stack traces) beyond the sample.
When a Case references an APM service, the Case header shows a clickable entity chip for that service. Selecting the chip opens APM, then Service Catalog for the service, with the time range already scoped to the Case time range so the data you land on matches the window the Case was triggered for.
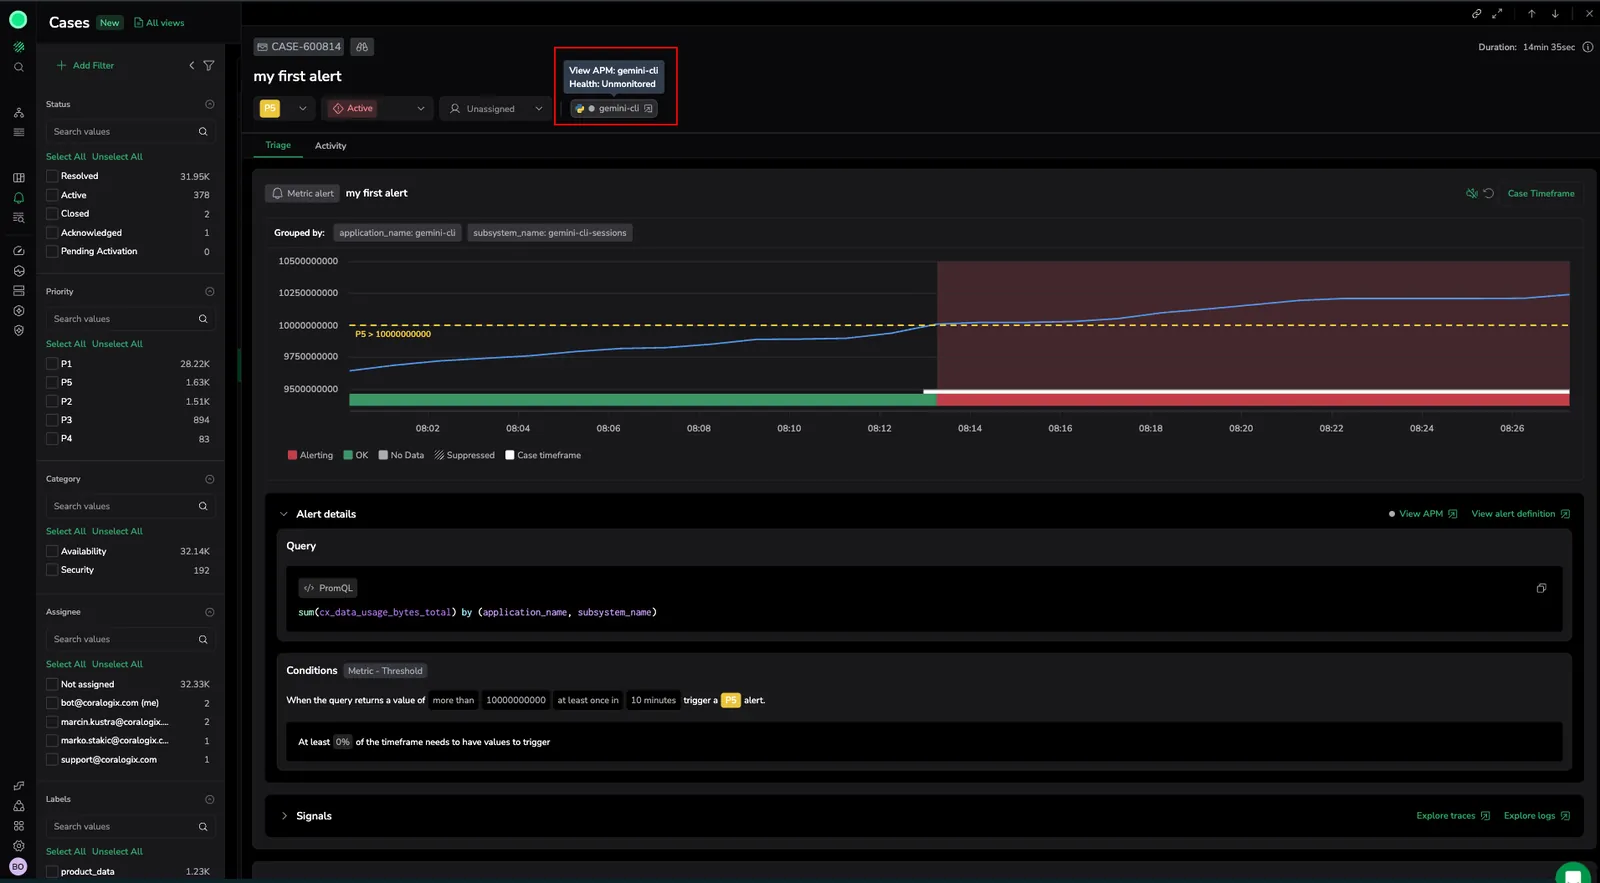
When a Case spans multiple permutations (for example, the same alert firing across several services), every entity has its own link in the header so you can pivot to the specific service in question without hunting through labels. In these Cases, the View APM link is also surfaced inline next to each entity in the Triage tab's Groups list, so you can pivot from a specific group to the relevant APM service.
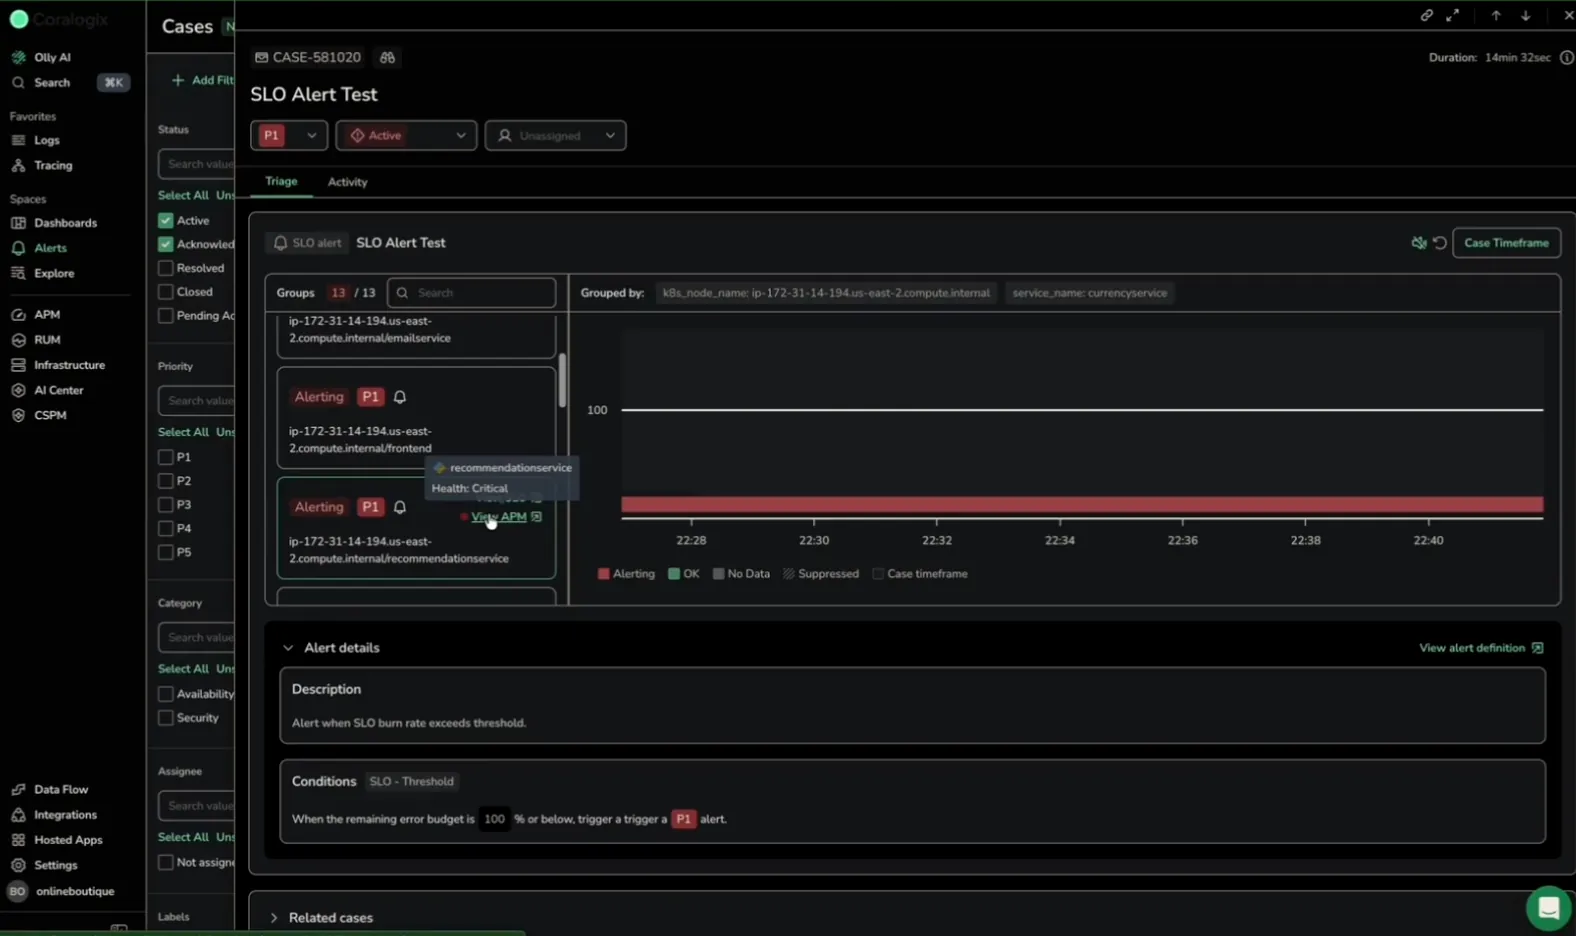
Select where to pivot
| Signal in the Case | Pivot to | When to use |
|---|---|---|
| Sample logs in the Triage tab | Logs Explorer | Query the full log dataset for patterns hinted at in the sample. |
| Sample spans in the Triage tab | Spans Explorer | Inspect service dependencies, latency, or error stack traces. |
| APM entity chip in the Case header | APM, then Service Catalog | Review service health, throughput, and error rate around the Case time range. |
All three Explores carry the Case's time range forward by default. Adjust the time picker in the destination view if you need a wider or narrower window.