Quick start
Configure Span Metrics using the method that applies to your environment and verify the installation.
Using Coralogix Complete Observability integrations
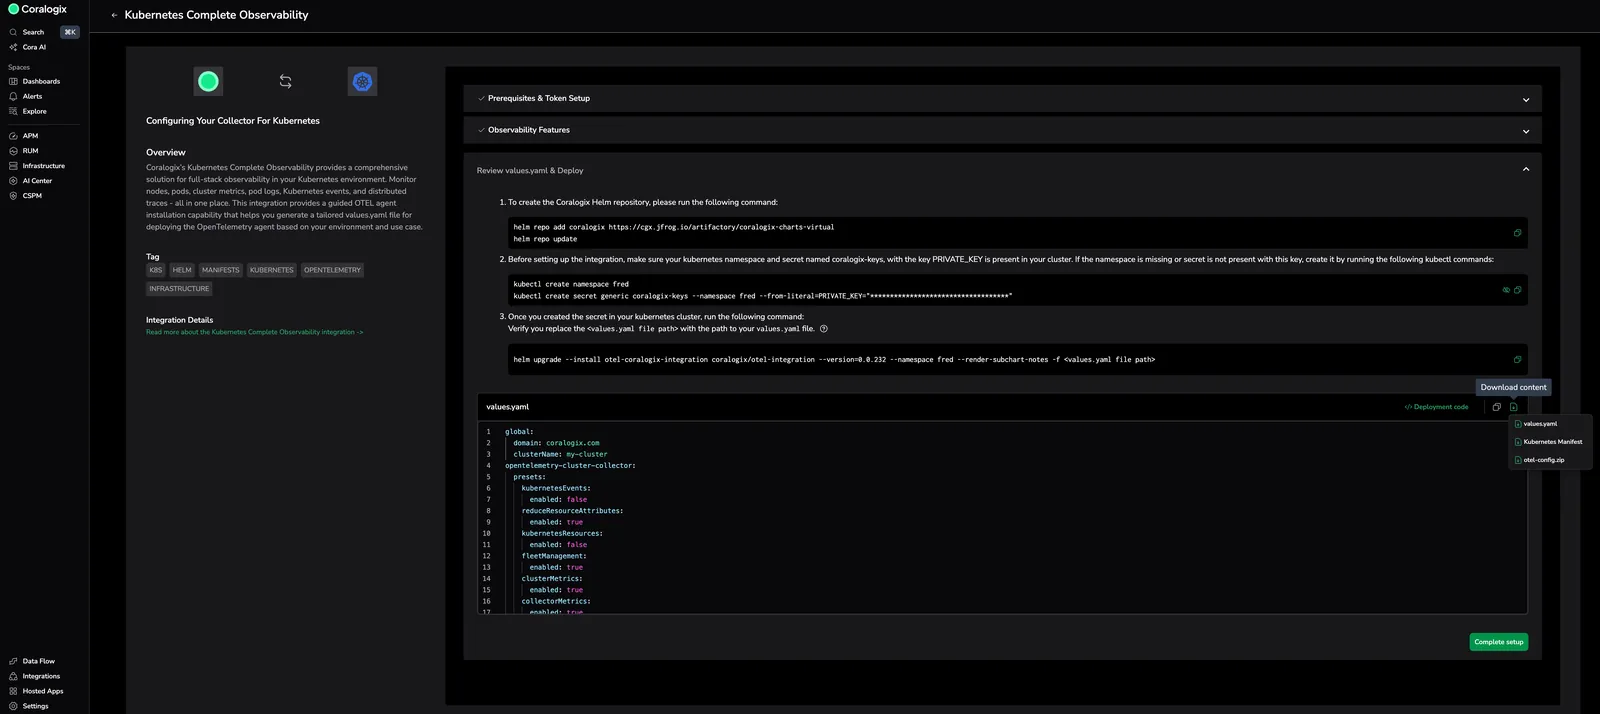
When working with Coralogix UI, the fastest way to enable APM with Span Metrics is using Coralogix Complete Observability integrations. They provides a comprehensive solution for full-stack observability in your Kubernetes or ECS-EC2 environment.
- Kubernetes: Monitor nodes, pods, cluster metrics, logs, Kubernetes events, and distributed traces-all in one place. This integration provides a guided OTEL agent installation capability that helps you generate a tailored
values.yamlfile for deploying the OpenTelemetry agent based on your environment and use case. For the installation instructions, refer to the Kubernetes complete observability: basic configuration page. Span Metrics is enabled by default withspanMetrics: enabled: trueand can be disabled by setting the value tofalsein the values.yaml file. - ECS-EC2: Deploy comprehensive OpenTelemetry monitoring for your AWS ECS-EC2 infrastructure. Monitor container metrics, application traces, logs, and infrastructure health across your ECS cluster. This integration provides guided deployment through CloudFormation or Terraform, enabling complete observability for your containerized workloads running on EC2 instances. For the installation instructions, refer to this document.
Using your own collector
After you deploy the configuration, verify that services appear in the Service Catalog and that RED metrics populate.
Metrics available with Span Metrics
The following metrics are produced by the OpenTelemetry Span Metrics connector and must be available for the Service Catalog, Databases Catalog, and optional features such as transactions, API error tracking, and version grouping.
Do not remove these metrics or their labels.
Minimal set of metrics and labels (Service catalog and db catalog drilldown pages)
| Metric | Label |
|---|---|
duration_ms_sum | span_name, service_name, span_kind, status_code, http_method, host_name, k8s_cluster_name, cgx.transaction, cgx.transaction.root, db_namespace, db_operation_name, db_collection_name, db_system, application_name, cx_subsystem_name |
duration_ms_bucket | span_name, service_name, span_kind, status_code, http_method, host_name, k8s_cluster_name, cgx.transaction, cgx.transaction.root, db_namespace, db_operation_name, db_collection_name, db_system, application_name, cx_subsystem_name, le |
calls_total | span_name, service_name, span_kind, status_code, http_method, host_name, k8s_cluster_name, cgx.transaction, cgx.transaction.root, db_namespace, db_operation_name, db_collection_name, db_system, application_name, cx_subsystem_name |
duration_ms_count | span_name, service_name, span_kind, status_code, http_method, host_name, k8s_cluster_name, cgx.transaction, cgx.transaction.root, db_namespace, db_operation_name, db_collection_name, db_system, application_name, cx_subsystem_name |
Additional labels to add for each metric:
rpc.grpc.status_code,http.response.status_codeto track API errors feature.service.versionfor grouping service metrics by version feature.k8s.deployment.namefor service to k8s correlations. This label correlates services with the resources catalog.k8s.pod.nameto avoid metric collisions in environments where each node runs its own collector. Without a stable per-pod attribute, metrics from the same service on different nodes might overwrite each other.
Next steps
Proceed to the Recommended Configurations document to configure Span Metrics for production environments and optimize its performance.
Once services are sending APM data, use Service Governance in the Metrics Usage Analyzer to attribute APM volume and cardinality per service and catch any service whose ingestion grows unexpectedly.