Application overview
The Application Overview dashboard offers essential observability insights at the application level, enabling users to monitor performance, costs, errors, security and quality issues, latency, and tool usage.
Every widget on this page is based on interactions — the full trace of a single exchange with an LLM, from the user's input, through any intermediate tool calls, to the model's final response (User input → LLM response or User input → tool calls → LLM response). See AI Center overview for the full definition.
Accessing the application overview dashboard
- In the Coralogix UI, navigate to AI Center > Application Catalog.
- Scroll down to the application grid and click on an app row to display its Application Overview page.
- Use the time picker to select the desired time interval for metrics collection.
- Proceed by scrolling to the appropriate Application Overview section.
Key insights
The Key insights header aggregates high-level signals for the selected application. Each counter is based on interactions — the end-to-end exchange between a user and an LLM — so you get an immediate read on responsiveness, reliability, and user reach.
- TTR – Measures the total time from when a user sends a request to when they receive the full response.
- Error Rate – The percentage of interactions with errors relative to all interactions in the application.
- Issue Rate – The percentage of interactions in this application flagged with issues based on evaluations or guardrail triggers.
- Guardrail Actions – The percentage of interactions where a guardrail action was applied.
- Total Interactions – The total number of interactions in the application.
- Unique Users – The number of distinct users who sent requests.

Activity
Investigate trends in interactions for this application, including issue rates and guardrail triggers over time.
- Total Interactions – The total number of interactions in the application.
- Issue Rate – The percentage of interactions in this application flagged with issues based on evaluations or guardrail triggers.
- Guardrail Actions – The percentage of interactions where a guardrail action was applied.
- Issues Over Time – Interactions flagged with issues in this application over time.

Issues
Visualize security and quality issues related to evals assigned to the application. An issue refers to an interaction flagged by an evaluation or a triggered guardrail action.
- Prompt Issues – The percentage of interactions flagged with issues originating from user inputs.
- Response Issues – The percentage of interactions flagged with issues originating from LLM outputs.
- Security Issues – Issues triggered by security-related evaluations or guardrails (e.g., prompt injection or PII exposure).
- Quality Issues – Issues triggered by quality-related evaluations or guardrails (e.g., user experience, hallucinations, toxicity, or compliance).

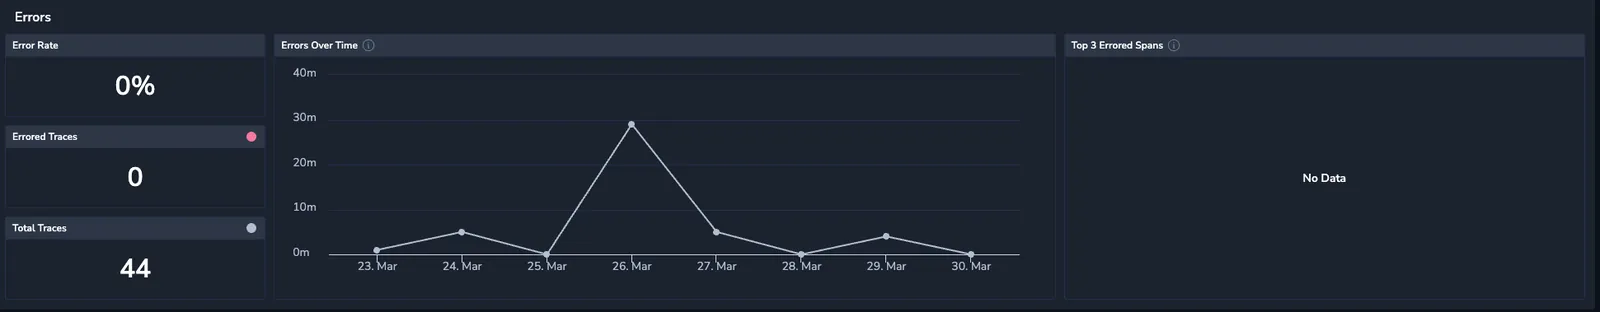
Errors
Monitor errors in your app, showcasing error counts and trends over time.
- Errors Over Time – Error trends over the selected time period.
- Error Rate – The percentage of interactions with errors relative to all interactions in the application.
- Errored Interactions – The total number of errored interactions in the application.
- Total Interactions – The total number of interactions in the application.
- Top Errored Spans – The spans with the highest error rates, displaying the percentage of failures.
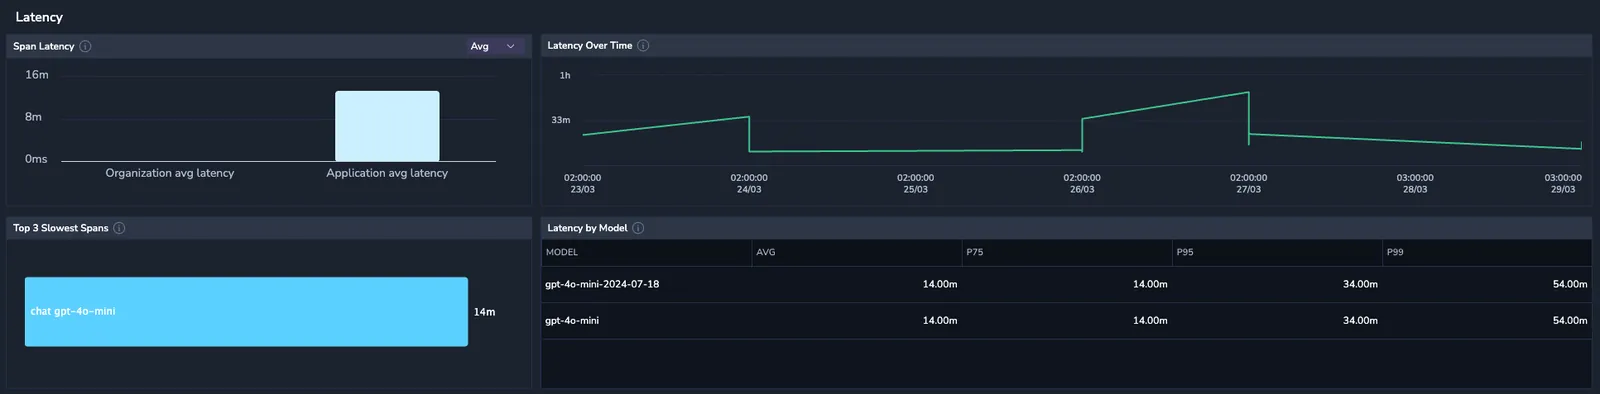
Latency
Investigate latency data to assess the delays between a user's request initiation and the LLM's response, including both the application and the models it uses.
- Time to Response – Measures the total time from when a user sends a request to when they receive the full response.
- Top Slowest Spans – The spans with the longest durations.
- Response Time Trends – Time to response trends over the selected period, segmented by average, P75, P90, P95, and P99.
- Latency by Model – Average, P75, P90, P95 and P99 interaction duration per used model.
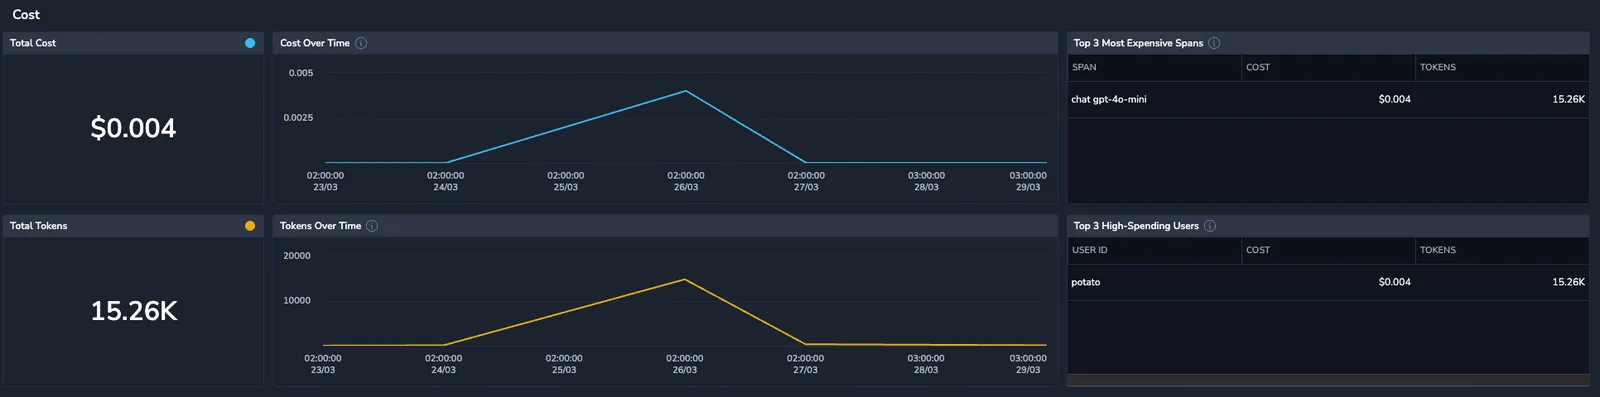
Cost
Analyze costs across different spans to identify whether some spans tend to be more expensive than others. All amounts are estimates, calculated by multiplying the token count by the cost per token for each model (excluding discounts or special plans).
- Total Cost – The overall expenditure, accompanied by a graph illustrating cost trends over time.
- Total Tokens – The cumulative token usage, with a corresponding graph tracking token consumption over time.
- Top 3 Most Expensive Spans – The 3 spans with the highest costs, ranked primarily by cost and secondarily by token usage.
- Top 3 High-Spending Users – The top 3 users based on spending, ranked by cost first, followed by token usage.
Tool calls
Visualize metrics for interactions where the application model sends requests to external tools, services, or systems as part of generating a response.
- Number of Tool Calls per Interaction – Distribution of tool calls per interaction.
- Tool Distribution – The usage frequency of each tool.
- Tool Usage in User-to-LLM Requests – The number of user-to-LLM interactions that triggered tool usage.
