AI Center overview
The AI Center Overview dashboard provides a centralized, data-driven observability hub for all your AI applications. Through the Overview dashboard, you will gain a holistic view of AI app health, performance, cost, quality issues, and security stance. This enhances decision-making and accelerates issue resolution, leading to improved performance and greater reliability across your entire AI library.
Every widget on this page is based on interactions. An interaction is the full trace of a single exchange with an LLM — from the user's input, through any intermediate steps (tool calls, guardrails, evaluations), to the model's final response. Two common shapes:
User input → LLM responseUser input → tool calls → LLM response
Counts, rates, and distributions below all roll up from interactions defined this way.
Accessing the Overview dashboard
- In the Coralogix UI, navigate to AI Center > Overview.
- Use the time picker to select the desired time interval for metrics collection.
- Continue your journey by scrolling to the relevant Overview section.
Key insights
The Key insights header aggregates high-level signals across all your AI applications. Each counter is based on interactions — the end-to-end exchange between a user and an LLM — so you get an immediate read on responsiveness, reliability, and user reach.
- TTR – Measures the total time from when a user sends a request to when they receive the full response.
- Error Rate – The percentage of interactions across all applications that contain errors.
- Issue Rate – The percentage of interactions flagged with issues based on evaluation results or triggered guardrails.
- Guardrail Actions – The percentage of interactions where a guardrail action was applied.
- Total Interactions – The total number of interactions across all applications.
- Unique Users – The number of distinct users who sent requests.

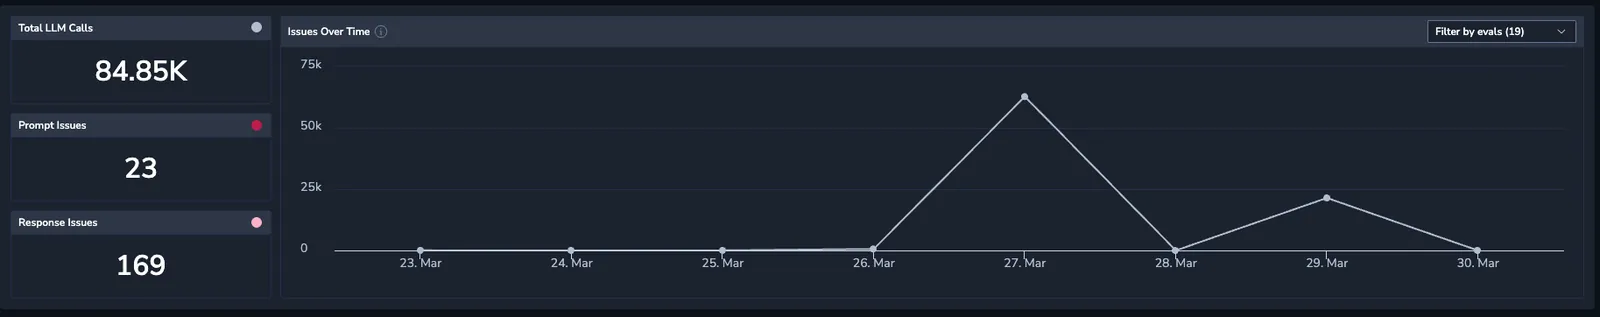
Activity
Track the volume and quality of interactions across all applications over time. Use this section to spot spikes in issues or guardrail triggers at a glance.
- Total Interactions – The total number of interactions across all applications.
- Issue Rate – The percentage of interactions flagged with issues based on evaluation results or triggered guardrails.
- Guardrail Actions – The percentage of interactions where a guardrail action was applied.
- Issues Over Time – Interactions flagged with issues across all applications over time.
Issues
Detect and mitigate potential risks by investigating overall message security and quality. An issue refers to an interaction flagged by an evaluation or a triggered guardrail action.
- Prompt Issues – The percentage of interactions flagged with issues originating from user inputs.
- Response Issues – The percentage of interactions flagged with issues originating from LLM outputs.
- Issue Distribution – Distribution of detected issues across Security and Quality categories based on evaluations and guardrail actions.
- Top Applications With Issues – Applications with the highest ratio of interactions flagged with issues.
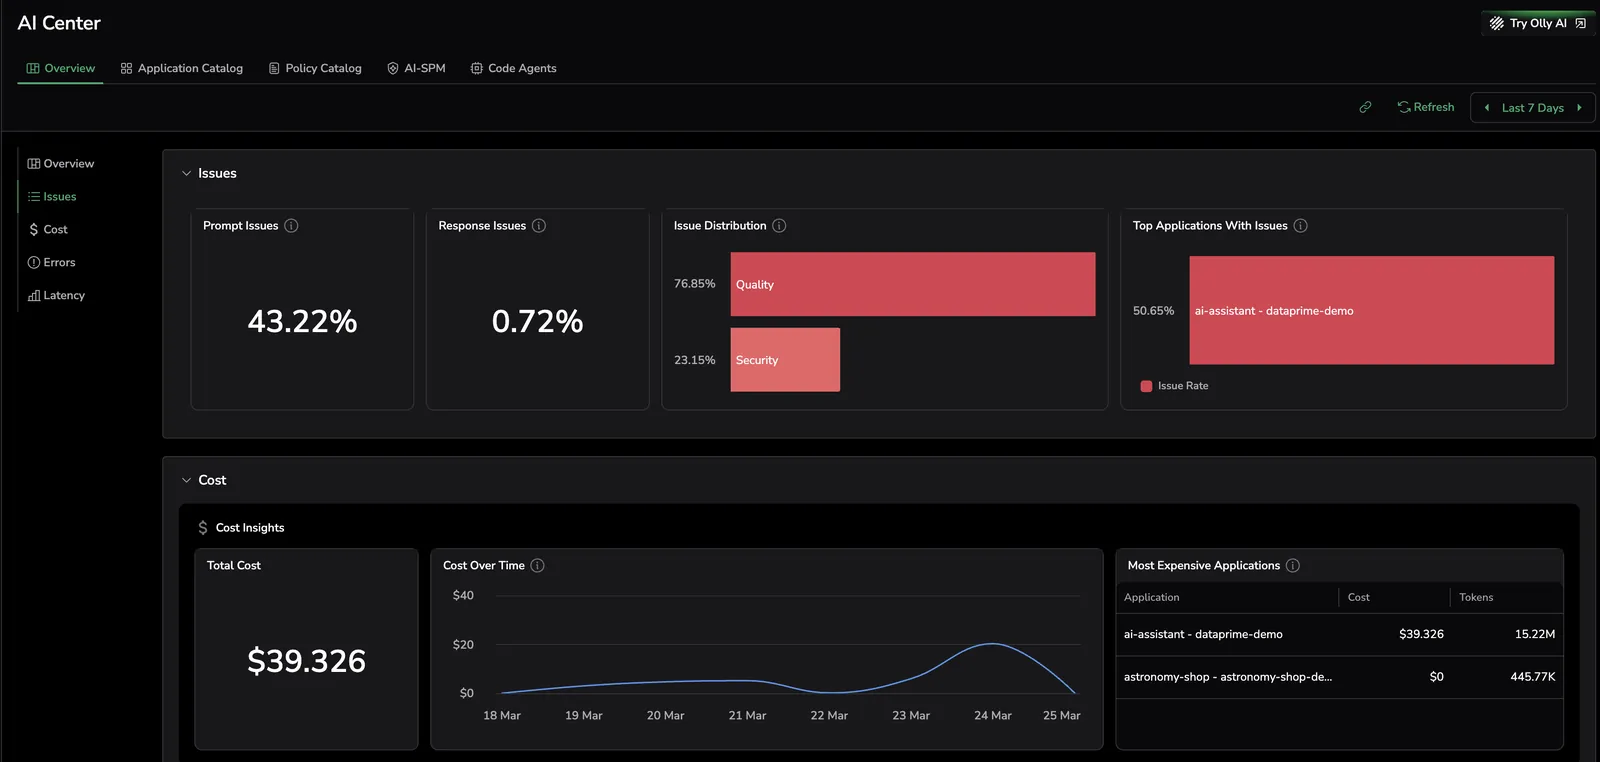
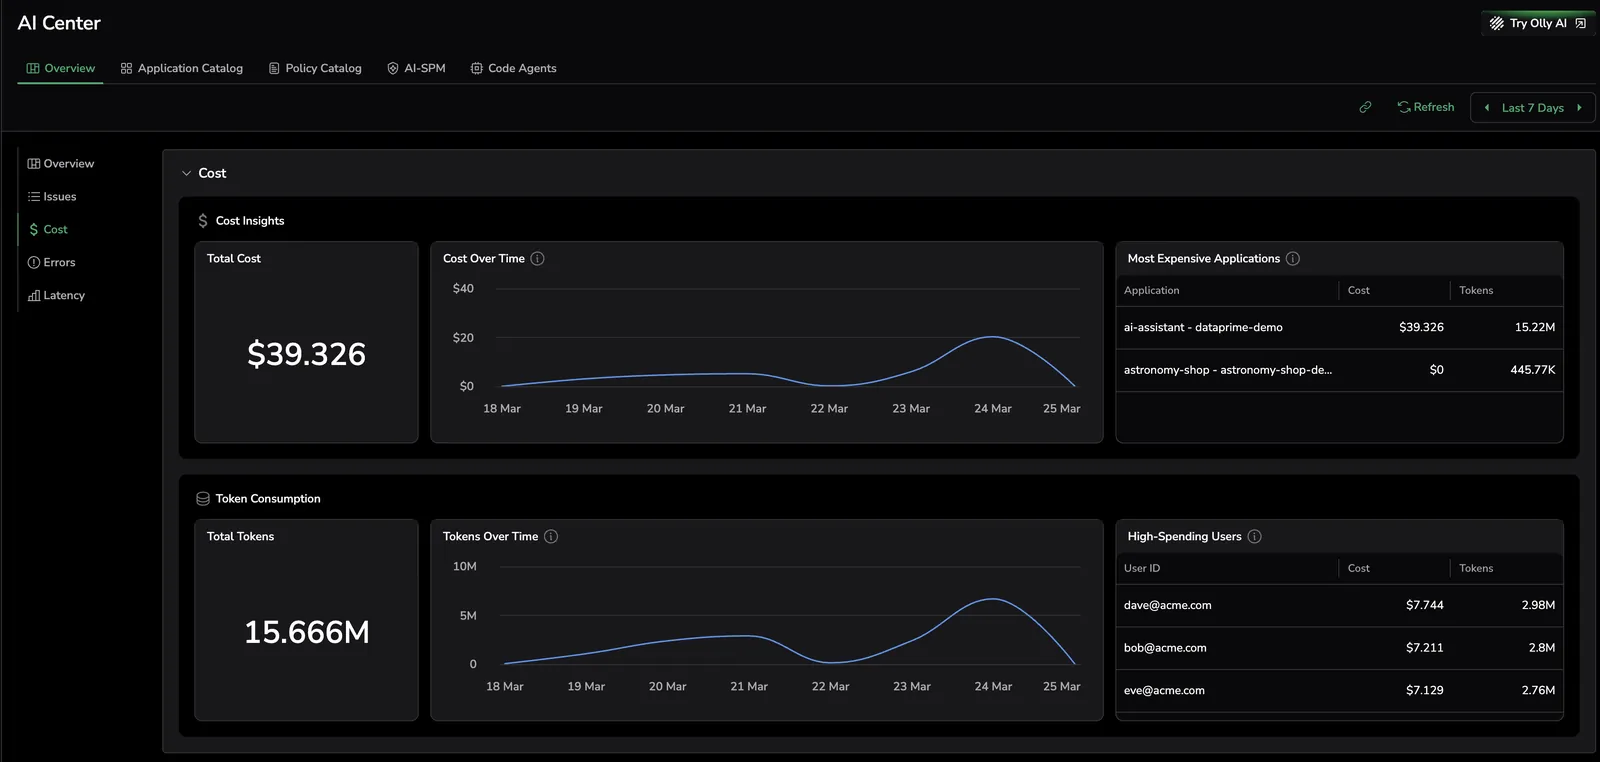
Cost
Gain a clear overview of token usage and associated costs. It helps you compare app expenses, identifies high-cost apps, and highlights users with significant spending, allowing for optimization or further investigation:
- Total Cost – The overall expenditure, accompanied by a graph illustrating cost trends over time.
- Total Tokens – The cumulative token usage, with a corresponding graph tracking token consumption over time.
- Top 3 Most Expensive Applications – The 3 apps with the highest costs, ranked primarily by cost and secondarily by token usage.
- Top 3 High-Spending Users – The top 3 users based on spending, ranked by cost first, followed by token usage.
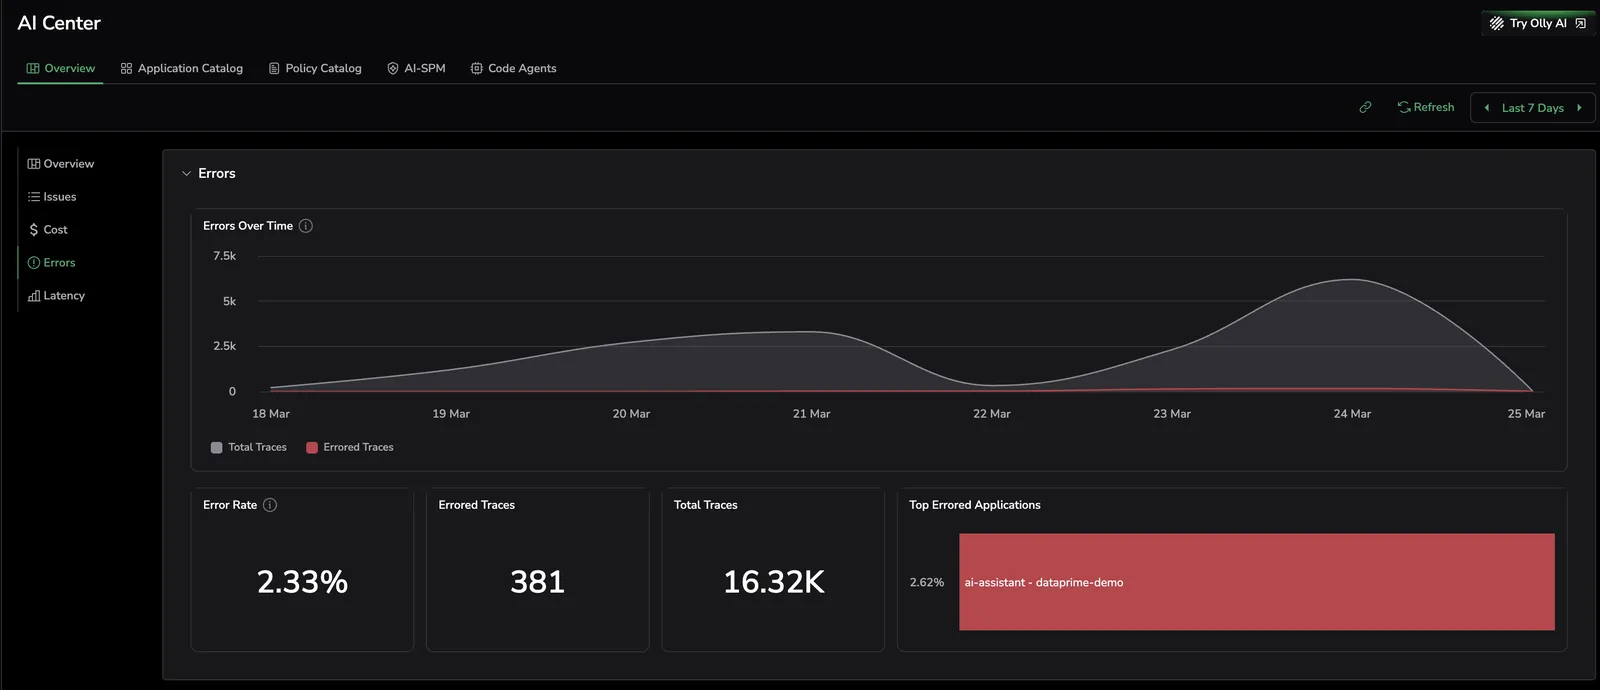
Errors
Monitor error trends across all your apps, highlighting error counts and rates over time.
- Errors Over Time – Error trends over the selected time period.
- Error Rate – The percentage of interactions across all applications that contain errors.
- Errored Interactions – The total number of errored interactions across all applications.
- Total Interactions – The total number of interactions across all applications.
- Top Errored Applications – Applications with the highest ratio of errored interactions.
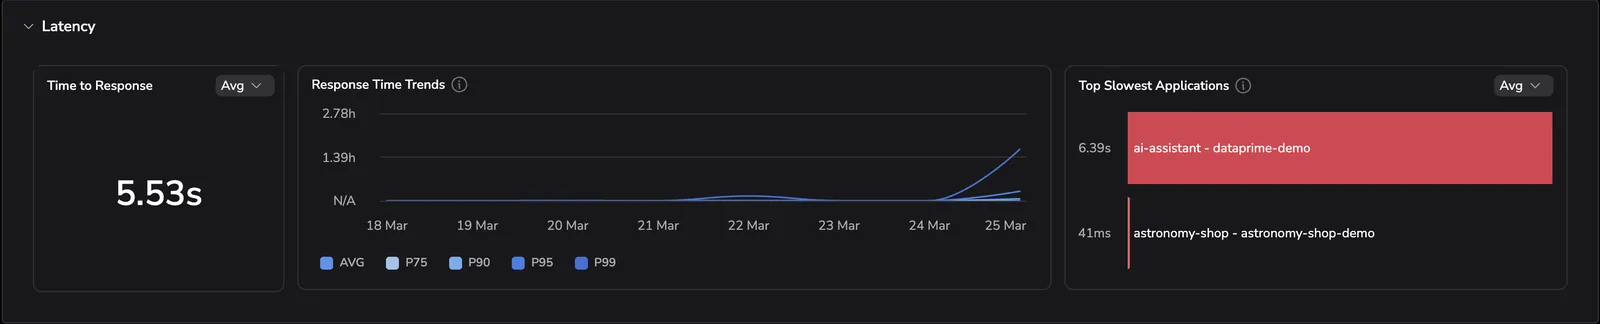
Latency
Investigate latency data to assess the delays between a user's request initiation and the LLM's output.
- Time to Response – Measures the total time from when a user sends a request to when they receive the full response.
- Response Time Trends – Time to response trends over the selected period, segmented by average, P75, P90, P95, and P99.
- Top Slowest Applications – The applications with the highest time to response.