Monitoring Windows server using OTel & Prometheus
This tutorial demonstrates how to monitor Windows Server - including IIS and MSSQL - for logs, metrics, and traces using OpenTelemetry Collector and Prometheus Windows Exporter.
Prerequisites
-
admin user in Windows with the ability to install services
-
tar.gzfiles unpacked
Configuration
Windows Exporter
STEP 1. Download the latest MSI from GitHub (0.22.0.msi as of 30 April '23).
STEP 2. Open the command line and navigate to C:\Users\Administrator\Downloads or the MSI folder.
STEP 3. Select which exporter collectors you require - including MSSQL and IIS - from this verbose list: cpu,cs,logical_disk,net,os,service,system,textfile,iis,mssql.
STEP 4. Open Command Prompt.
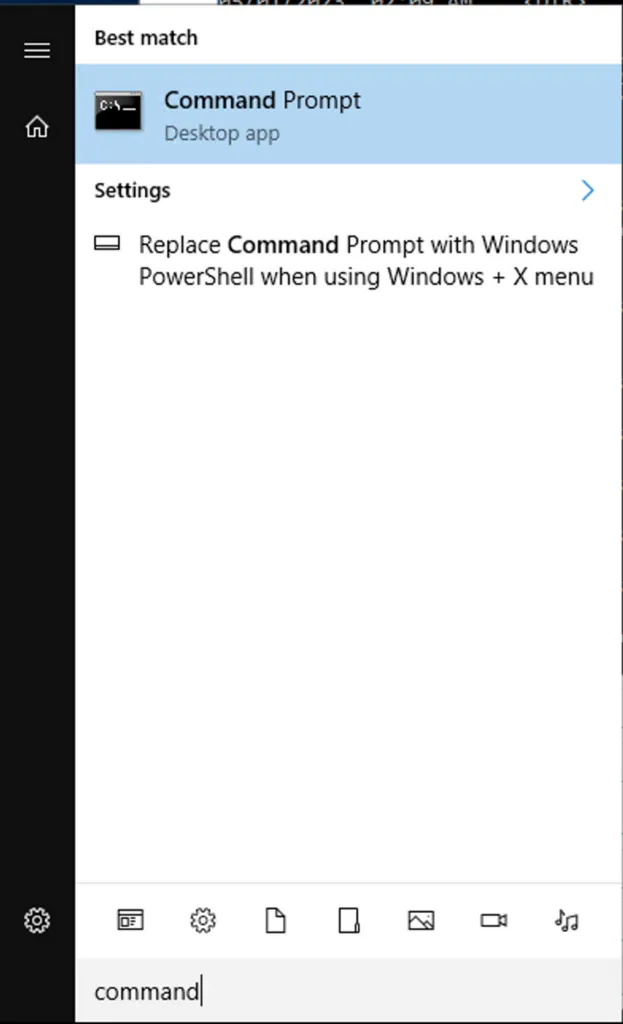
STEP 5. Run the following command to install the MSI with the collectors chosen:
msiexec /i windows_exporter-0.22.0-amd64.msi ENABLED_COLLECTORS="os,iis"
OpenTelemetry Collector
STEP 1. Download the latest tar.gz from GitHub (0.76.1.tar.gz as of 30 April '23).
STEP 2. Unpack the content into a C:\\cx-otel. This may require you to install a program to unpack tar.gz files.
STEP 3. Create a config.yaml based on the following configuration.
receivers:
  filelog:
    include: [ C:\inetpub\logs\LogFiles\*.* ]
  prometheus:
    config:
      scrape_configs:
        - job_name: 'windows_exporter'
          scrape_interval: 15s
          static_configs:
            - targets: ['0.0.0.0:9182']
processors:
  resourcedetection:
    detectors: [system]
    system:
      hostname_sources: ["os"]
  batch:

exporters:
  coralogix:
    metrics:
      endpoint: "ingress.eu2.coralogix.com:443"
    logs:
      endpoint: "ingress.eu2.coralogix.com:443"
    private_key: "coralogix-api-key"
    application_name: "WinServer"
    subsystem_name: "Host"

service:
  pipelines:
    metrics:
      receivers: [prometheus]
      processors: [resourcedetection, batch]
      exporters: [coralogix]
    logs:
      receivers: [filelog]
      processors: [resourcedetection, batch]
      exporters: [coralogix]
Notes:
-
The example configuration captures metrics from windows_exporter and logs from IIS. Modify as necessary.
-
You are required to input the following variables:
-
endpoint: Select the OpenTelemetry endpoint associated with your Coralogix domain -
private_key: Your Coralogix Send-Your-Data API key -
application_name&subsystem_name: Application and subsystem names as they will appear in your Coralogix UI
-
STEP 4. Install the collector as a service by running the following command:
sc.exe create cx-otelcol displayname=cx-otelcol start=delayed-auto binPath="C:\cx-otel\otelcol-contrib.exe --config C:\cx-otel\config.yaml"
STEP 5. Run the service.
sc.exe start cx-otelcol
Additional Configurations
Configure Windows exporter dashboards and the OpenTelemetry Kubernetes Extension to monitor the collector itself.
Validation & Testing
STEP 1. Open Services and check that both windows_exporter and cx-otelcol service are running.
STEP 2. To validate which metrics exist in windows_exporter, navigate to http://localhost:9182/metrics.
Notes:
-
windows_exporter.exeis unsafe and may require a specific "unblock" in its settings. -
Both
windows_exporterandotelcolcan be run without services to check for logs in the command prompt.
STEP 3. Navigate to Grafana Explore to confirm that windows_* metrics are arriving in your Coralogix dashboard.